TIBCO Spotfire Consumer/Business Author User's Guide
In this guide you learn how to get the most out of TIBCO Spotfire Consumer/Business Author User's Guide. You get tips on how to get started with analyzing data as well as get detailed information on what you can do, and how.
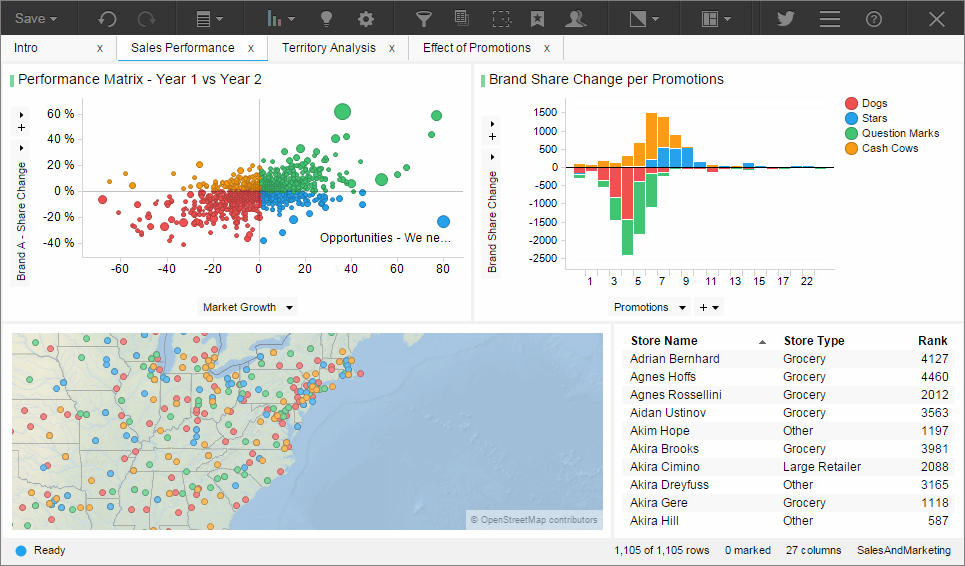
You can present data in form of different visualizations but also interact with the visualizations in various ways to gain more insight about the data.
Getting started
To get a quick start, see
- Creating a new analysis and Opening an existing analysis to learn how to bring data into an analysis
- Creating a visualization to learn how to set up various types of visualizations
Using Recommended visualizations
You do not need to create visualizations from scratch. When adding data and selecting data columns of interest, you are presented with recommended visualizations. Simply choose visualizations you find suitable, and use them as they are, or adjust them to suit your needs. Besides, you can anytime during your session get this assistance to create visualizations. Click
 in the toolbar to access
Recommended visualizations.
in the toolbar to access
Recommended visualizations.