Creating a table
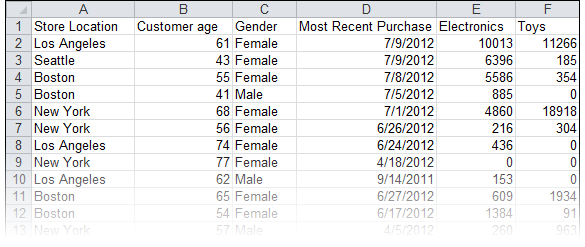
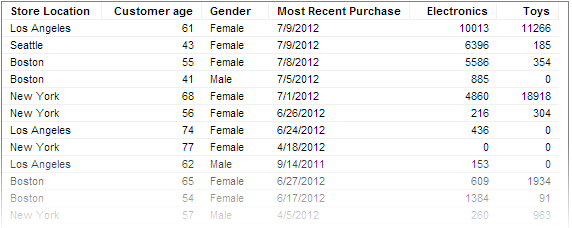
The table visualization presents the details of the data. The individual values are arranged in columns and rows.
Procedure
 , and select
Copyright © TIBCO Software Inc. All Rights Reserved.
The table visualization presents the details of the data. The individual values are arranged in columns and rows.