Selecting columns on an axis

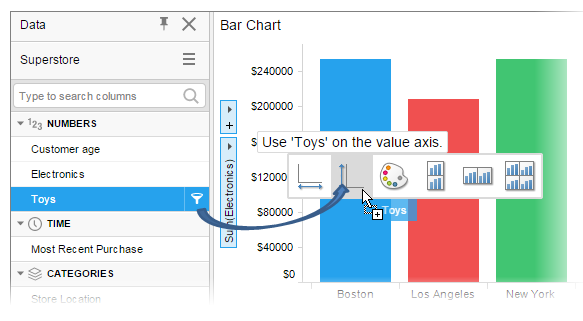
When creating a visualization, you select which data columns to show on various axes such as on the X-axis, the Y-axis and the Color axis.

Along each axis, you find a column selector, for example 
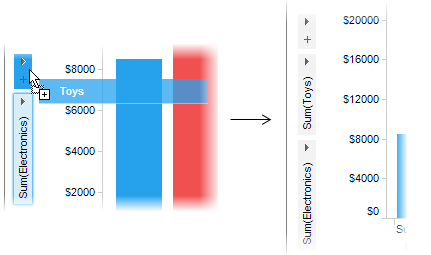
, which displays the current column. To switch to another column, or add more columns to an axis, either use the Data panel or use the column selector itself.

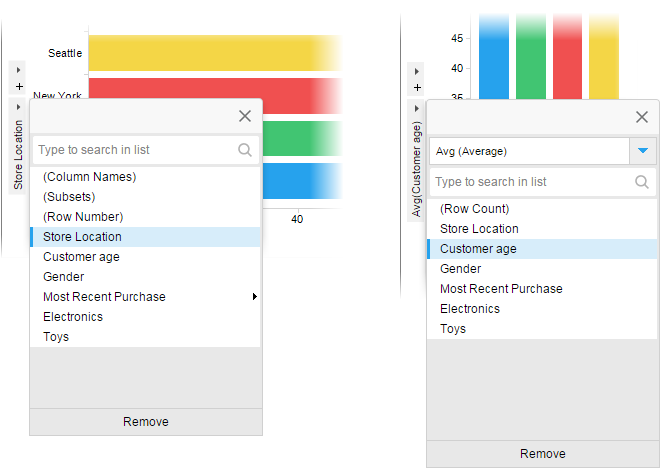
Selecting columns using the Data panel

Procedure

  1. If the Data panel is not visible, click the The toolbar Data button button in the toolbar.
  2. In the panel, select the column you want to show and drag and drop it on a column selector.

    • Alternatively, select the column and drag and drop it on the drop target that appears in the middle of the visualization. Each target represents a certain axis.
      Drag and drop column on droptargets
  3. To display more than one column on the axis, select another column and drag and drop it on the other drop-down menu in the column selector.


    Note: A new drop-down menu appears to make it possible to add more columns. When the number of columns added to an axis exceeds three, the name of each column will no longer be displayed, only the number of columns.

Selecting columns using the column selector

Procedure

  1. In the column selector, click on the arrow next to the column name.
    A popover listing all columns in the data table opens. Depending on the type of axis and type of column data, the popover might look slightly different.

  2. Select a column in the popover.
  3. In case you want to display more than one column on the axis, click the other drop-down menu arrow in the column selector, then select the column of interest.
    The result is similar to the result you get when using the Data panel above.
  4. Click anywhere outside the popover to close it.
    Note: When the number of columns added to an axis exceeds three, the name of each column is no longer displayed, only the number of columns.